
The Venezuelan Oil Illusion
Why Trump’s Energy Strategy Won’t Lower Prices at the Pump Anytime Soon


By Devon Levack
Author’s Note: My analysis of energy logistics isn’t theoretical—it’s built on hands-on experience across the entire energy value chain. Having worked in upstream extraction, midstream transport, and downstream processing with operators like TransCanada Pipelines, NOVA Gas Transmission, Imperial Oil, Interprovincial Pipe Line, Talisman Energy, Nexen Energy, and Gulf Canada Resources, I’ve seen firsthand how rigid and capital-intensive heavy crude operations really are. When politicians claim foreign imports can instantly replace active supply lines, they are ignoring basic engineering realities.
In recent geopolitical energy declarations,
former President Donald Trump has suggested that Venezuelan oil could seamlessly displace Canadian crude imports while driving down prices at American gas pumps. It is a compelling soundbite for an electorate weary of inflation. But as anyone who has worked near the ground in heavy oil operations knows, reality does not conform to political rhetoric.
When you break down the logistics, engineering constraints, and legal frameworks governing Venezuelan heavy crude, a stark picture emerges: this oil will not meaningfully impact American gas prices for at least five to seven years—if not a decade.
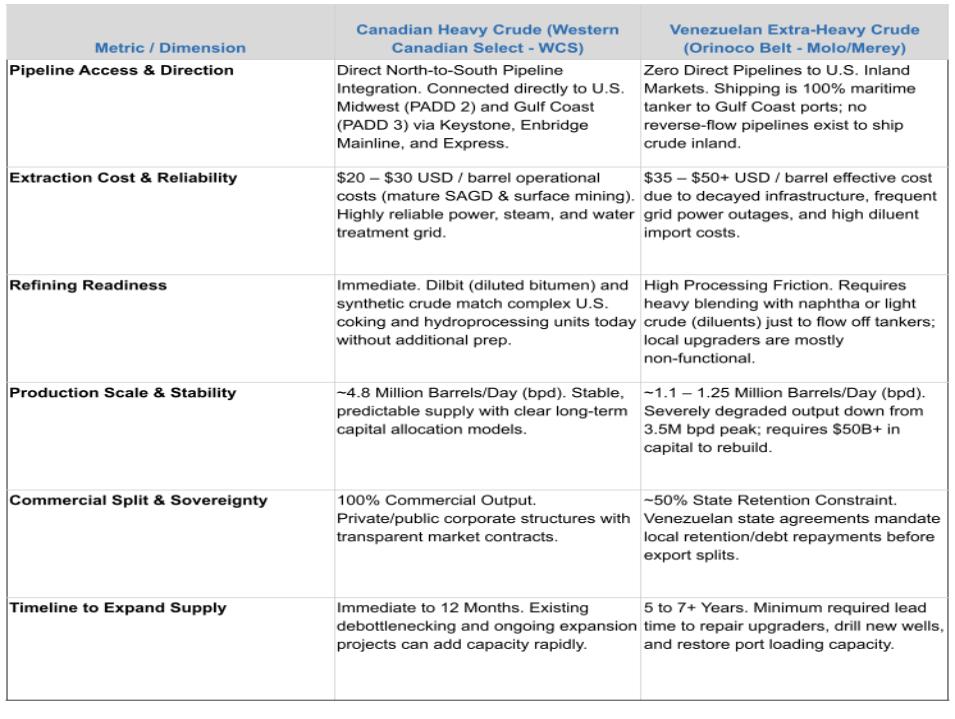
Canadian Heavy Crude vs. Venezuelan Heavy Crude: A Strategic Comparison
To understand why replacing Canadian barrels with Venezuelan imports is logistically unfeasible, we must look at the structural differences across extraction, midstream transport, and refining integration:
The Physics and Timelines of Heavy Crude
Extracting and refining extra-heavy crude differs greatly from tapping conventional light oil. Venezuela’s Orinoco Belt holds vast reserves, but the oil is dense, viscous, tar-like material. It cannot simply be pumped into a standard pipe and shipped. It requires:
- Diluents and Upgraders: The crude must be blended with lighter hydrocarbons or processed through costly bitumen upgraders just to make it flow through transport lines.
- Infrastructure Rebuilding: Decades of underinvestment and neglect have left Venezuela’s oil infrastructure in near-total disrepair. Current production sits around 1.1 to 1.25 million barrels per day (bpd)—a fraction of its historical peak of 3.5 million bpd.
- The 7-Year Horizon: Bringing major new drilling projects, upgraders, or specialized refining capacity online in a severely degraded supply chain takes at least five to seven years. From engineering design and capital allocation to construction and commissioning, there are no shortcuts in heavy crude.
The 50% Constraint: What Reaches the U.S.?
Even if production capacity expands dramatically, the framework governing these international agreements specifies that a significant portion—often around 50%—of produced crude remains tied to local state retention, debt obligations, or non-U.S. commitments.
If only half of the increased production actually reaches American refineries, the net volume added to the U.S. market will be far too small to shift global price curves in the short-to-medium term.
Supply Chain Realities and Canada’s Role
The U.S. refining footprint poses another major bottleneck:
- The Pipeline Directional Problem: Most major North American crude pipelines run north-to-south, carrying heavy Canadian crude straight into Midwest and Gulf Coast refineries.
- Logistical Limits: If Venezuelan crude arrives by tanker along the Gulf Coast, moving that product northward to upper-tier U.S. markets requires reverse-flow pipeline logistics that largely do not exist. Imported Venezuelan oil will remain geographically trapped in the Gulf region.
- The Canadian Alternative: Canadian crude represents an established, reliable, and active supply line with existing cross-border pipeline connections. Threatening trade relations or pipeline agreements with Canada under the assumption that Venezuela can immediately plug the gap ignores basic midstream energy logistics.
Midstream Pipeline Infrastructure Maps
Map Source 1: Static North American Crude Trunk Pipeline Network
For a complete geographic overview of cross-border crude flow from Western Canada down to PADD 2 (Midwest) and PADD 3 (Gulf Coast), refer to the official public map:
🔗 EIA / Wikimedia Commons: Select Crude Oil Pipelines in the United States and Canada
Map Source 2: EIA Interactive Energy Mapping System
To inspect specific pipeline layers, refinery coking capacities, and regional PADD flow directions dynamically, explore the official U.S. Energy Information Administration portal:
🔗 U.S. Energy Information Administration (EIA) Interactive Mapping Tool
Geopolitics and the Middle East Bottleneck
While American trade strategy leans into speculative Venezuelan returns, global energy supply remains tied up in critical maritime choke points—most notably the Strait of Hormuz.
A realistic approach to stabilizing global energy prices requires lowering risks around key shipping routes so existing global supply can reach markets efficiently, rather than waiting for multi-year infrastructure overhauls in South America.
The Bottom Line for American Consumers
Telling American voters that Venezuelan crude will deliver quick relief at the pump fundamentally misrepresents how the energy sector operates.
American consumers and policymakers must understand the timeline:
- Immediate Impact: Zero.
- Short-Term (1–4 Years): High capital expenditures, infrastructure rebuilding, and negligible market relief.
- Long-Term (5–10 Years): Potential volume additions, constrained by contract splits and regional refining logistics.
Holding back stable energy partnerships with Canada in favour of a 10-year Venezuelan gamble leaves American consumers exposed to higher fuel costs and supply volatility today. Energy security isn’t built on promise—it’s built on pipelines, refineries, and practical timelines.
Sources & Operational Benchmarks
Canadian Oil Sands Operational Benchmarks:
Costs & Lifting Efficiency: Alberta Energy Regulator (AER) ST98 Annual Reports & Operator Guidance (Cenovus, Suncor, MEG Energy). SAGD operating costs routinely average $10–$15 USD/bbl on a pure lifting basis, with total operational cash cost (OPEX + sustaining CAPEX + natural gas steam generation) sitting at $20–$28 USD/bbl.
Capacity & Logistics: Canadian Association of Petroleum Producers (CAPP) & Canada Energy Regulator (CER). Production averages ~4.8 million barrels/day with dedicated North-to-South pipeline infrastructure (Enbridge Mainline, Trans Mountain Expansion, Keystone).
Venezuelan Heavy Crude (Orinoco Belt) Benchmarks:
Full-Cycle & Effective Operating Costs: Rystad Energy & Incorrys International Heavy Oil Supply Assessments. Wellhead lifting costs average $12–$18 USD/bbl, but effective operating costs scale to $35–$50+ USD/bbl when accounting for imported diluents (naphtha/light crude at an $8–$15/bbl penalty), frequent power-grid downtime, and severe port demurrage.
Production Scale & Rebuilding Capital: U.S. Energy Information Administration (EIA) & OPEC Monthly Oil Market Reports (MOMR). Output stands at ~1.1–1.25 million barrels/day, requiring an estimated $50B+ in capital reinvestment and 5–7+ years of sustained development to restore historical capacity.
Midstream Pipeline Networks & Flow Directions:
U.S. Energy Information Administration (EIA) Interactive Mapping Tool & Liquids Pipeline Mapping System.
Public Domain Infrastructure Data: EIA / Wikimedia Commons (Select Crude Oil Pipelines in the United States and Canada).
“The Signal Fires is completely free to read and always will be. If you enjoyed this piece and want to support my work, you can buy me a coffee here.”